First Run
Once Edge Insights is installed, open the portal:
- Windows: start "Edge Insights" from the Start menu or the desktop shortcut. The application starts the services and opens the portal.
- Linux desktop: start "Edge Insights" from the application menu. The application starts the services and opens the portal.
- Embedded device: open
http://<device-hostname-or-ip>:36300in a browser on another machine on the same network.
Initial setup
The portal opens a setup wizard the first time you launch Edge Insights. You can run it again later from the Re-run setup wizard link on the Home page. See Running the wizard again.
The wizard saves nothing until its last step. Until then, you can go Back and change any step. The settings take effect when you finish the last step.
-
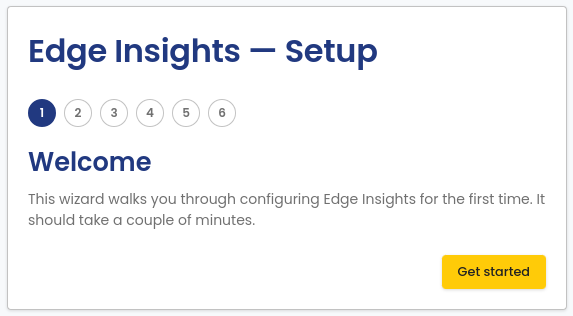
Welcome: a short introduction.
-
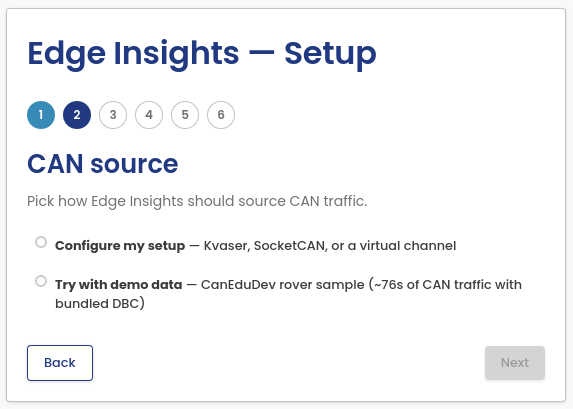
CAN source: choose Configure my setup to select a real interface, or Try with demo data to explore Edge Insights with a bundled sample log instead of live hardware. Demo data skips steps 3 to 5. Its last step loads the sample log and the matching DBC file.
-
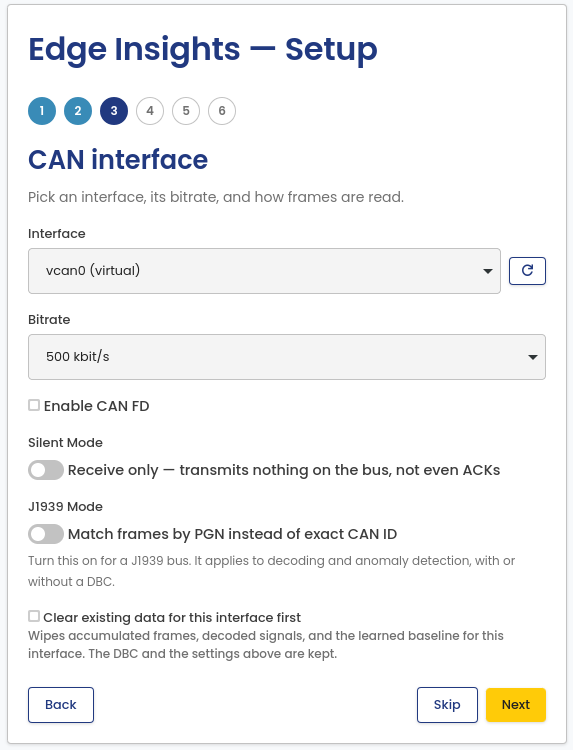
CAN interface: pick the interface, its bitrate, and how frames are read. Turn on J1939 Mode for a J1939 bus. See CAN Settings for details on each option. Silent Mode stays off for a channel that does not support it, for example a Kvaser virtual channel.
This step can also clear what is already recorded for the interface you pick. Tick Clear existing data for this interface first to start from a clean state, for example on a device redeployed to a different bus. It is off by default. The data is deleted when you finish setup, not on this step. The DBC file and your settings are not removed.
-
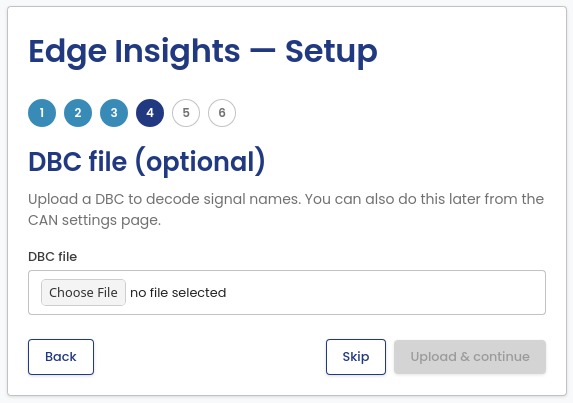
DBC file (optional): upload a DBC file so Edge Insights can decode raw CAN frames into named signals. Current DBC File shows the file in use, or "None configured". Choose a file under Upload DBC and click Upload & continue. Edge Insights checks that the file is a valid DBC file, but uses it only when you finish setup. If you return to this step, it shows the uploaded file name and its number of messages. Click Skip to continue without a DBC file. You can add or change the file later from the CAN Settings page.
-
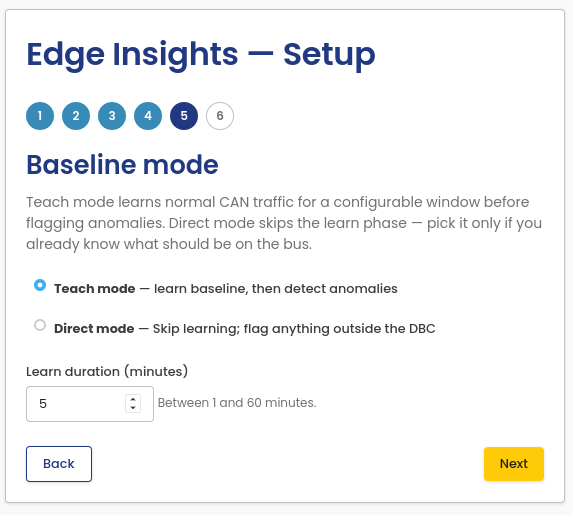
Baseline mode: choose Teach mode to let Edge Insights learn normal bus behavior for a set duration (1 to 60 minutes) before flagging anomalies, or Direct mode to start anomaly detection immediately with no baseline.
-
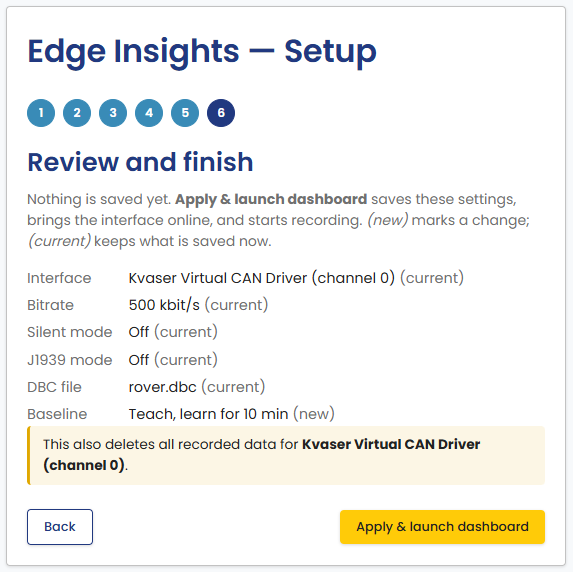
Review and finish: check the settings before they are saved. The list shows the interface, bitrate, silent mode, J1939 mode, DBC file, and baseline. (new) marks a value that this run changes. (current) marks a value that stays as it is saved now. If you ticked Clear existing data for this interface first, a warning states that the recorded data for the interface is deleted.
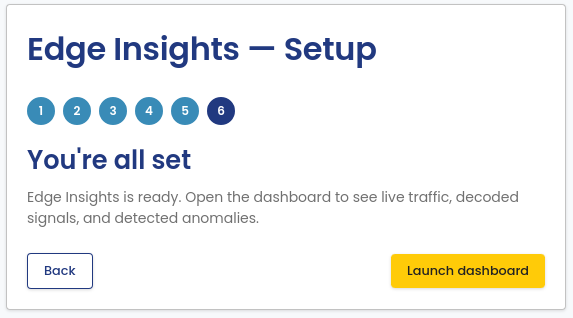
Click Apply & launch dashboard. Edge Insights saves all settings, brings the interface online, and starts recording and analysis. Then the portal opens the Home page. If no interface is configured, the button only saves the settings.
If the interface cannot be brought online, the wizard stays on this step and shows an error. Fix the cause and click Apply & launch dashboard again, or click Back to change the settings.
If no CAN hardware is connected, use the Try with demo data option above, or import a log later from Import Log.
Running the wizard again
Click Re-run setup wizard on the Home page to change the settings later. The wizard starts from the saved settings. As on the first run, nothing is saved until the last step.
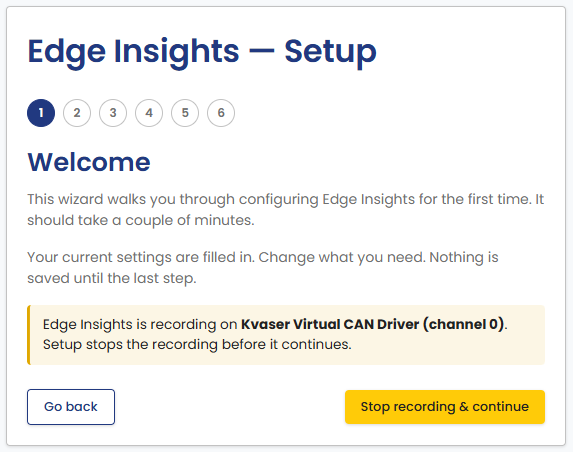
If Edge Insights is recording when the wizard opens, the Welcome step shows a warning. Setup stops the recording before it continues. The warning has two buttons:
- Stop recording & continue stops the recording and continues to the next step.
- Go back returns to the Home page. Recording continues. This button is not shown if recording is already stopped.
On the CAN interface and DBC file steps, Keep current keeps the saved settings of that step and continues. The button reads Skip when nothing is configured for that step yet. On the CAN interface step, Keep current also ignores Clear existing data for this interface first.
Apply & launch dashboard on the last step starts recording again. If you leave the wizard before the last step, nothing is saved. To resume recording, bring the interface up from CAN Settings.
Activate the license
- Copy your license key from the License keys page of your canedudev.com account. See Getting Edge Insights if you do not have a key yet.
- On the portal Home page, enter the key in the License card and click Activate.
The machine that runs Edge Insights needs an internet connection to activate. After activation, Edge Insights runs offline. See Licensing for details on the License card.
Next steps
The Portal Guide describes each part of the portal: CAN settings, importing and exporting data, and the Grafana dashboards.