Export Log
Export recorded raw CAN data as a candump .log file. Open it from
Export Log in the portal sidebar.
Range
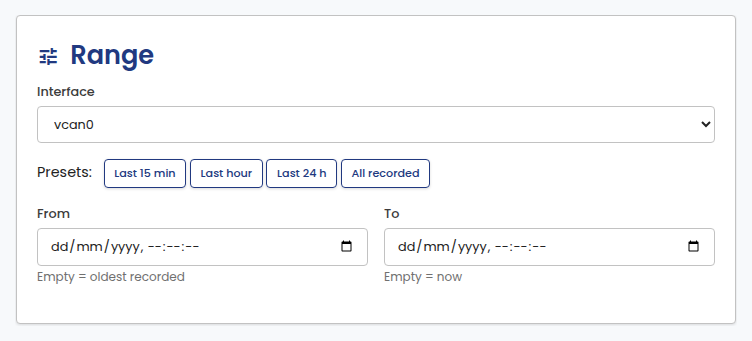
Pick an interface and a time range, either with a preset or explicit From/To timestamps. Leave From empty to start at the oldest recorded frame, and To empty for now.
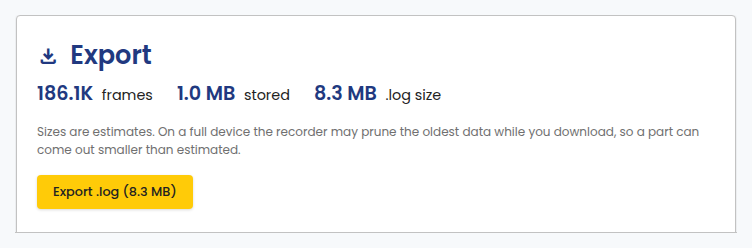
Export
The estimate updates as you adjust the range: frame count, stored size,
and resulting .log size. Sizes are estimates. If storage limits are
active, the oldest data may be pruned while the download runs, so the file
can come out smaller than estimated.
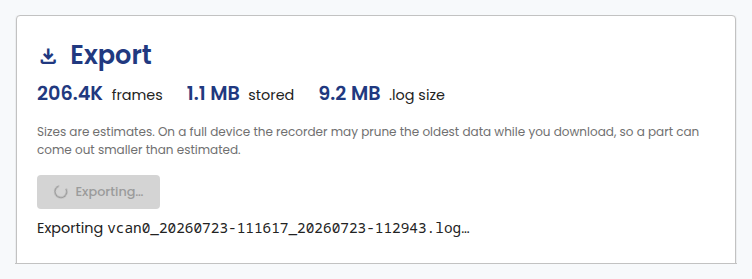
Click Export .log to start. The button shows progress while the file is prepared:
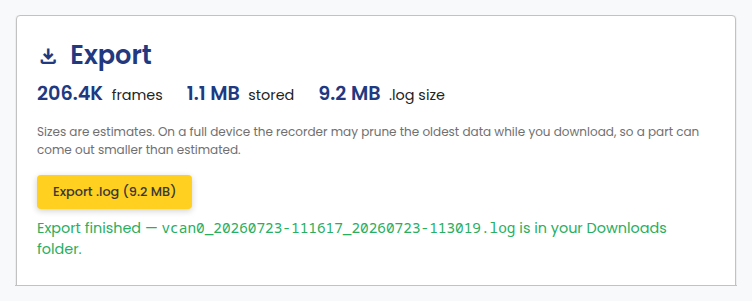
When it finishes, the downloaded file name appears below the button:
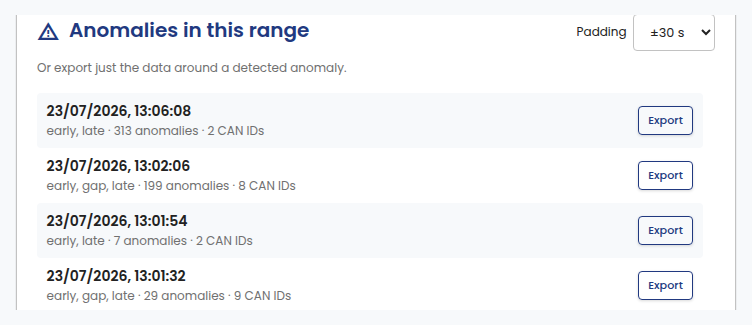
Anomalies in this range
Detected anomalies in the selected range are listed below the export controls, each with its own Export button. Use this to export just the data around a specific anomaly instead of the whole range.
By default, the Padding list is set to Minimal. The export then holds about three seconds of data around the anomaly. To include more data before and after the anomaly, select ±10 s, ±30 s or ±60 s.
Export from a dashboard
Each Dashboard has its own Export raw data for this range link in its toolbar. Clicking it opens Export Log with the interface and time range already set to match what the dashboard was showing, so you can jump straight to exporting a range you spotted on a chart.