Portal Guide
The Edge Insights portal is the local web UI you use to configure capture, manage DBC files, import and export data, and view Grafana dashboards.
On a desktop PC (Windows or Linux), Edge Insights runs through a launcher:
it starts the analytics services and opens the portal in its own window,
then stops the services again when you close that window. You can also
open the same portal in a regular browser instead, at
http://localhost:36300, if you prefer. On an embedded or headless
device there is no launcher: the services run continuously in the
background, and a browser is the only way to reach the portal, from
another machine on the network.
Home page
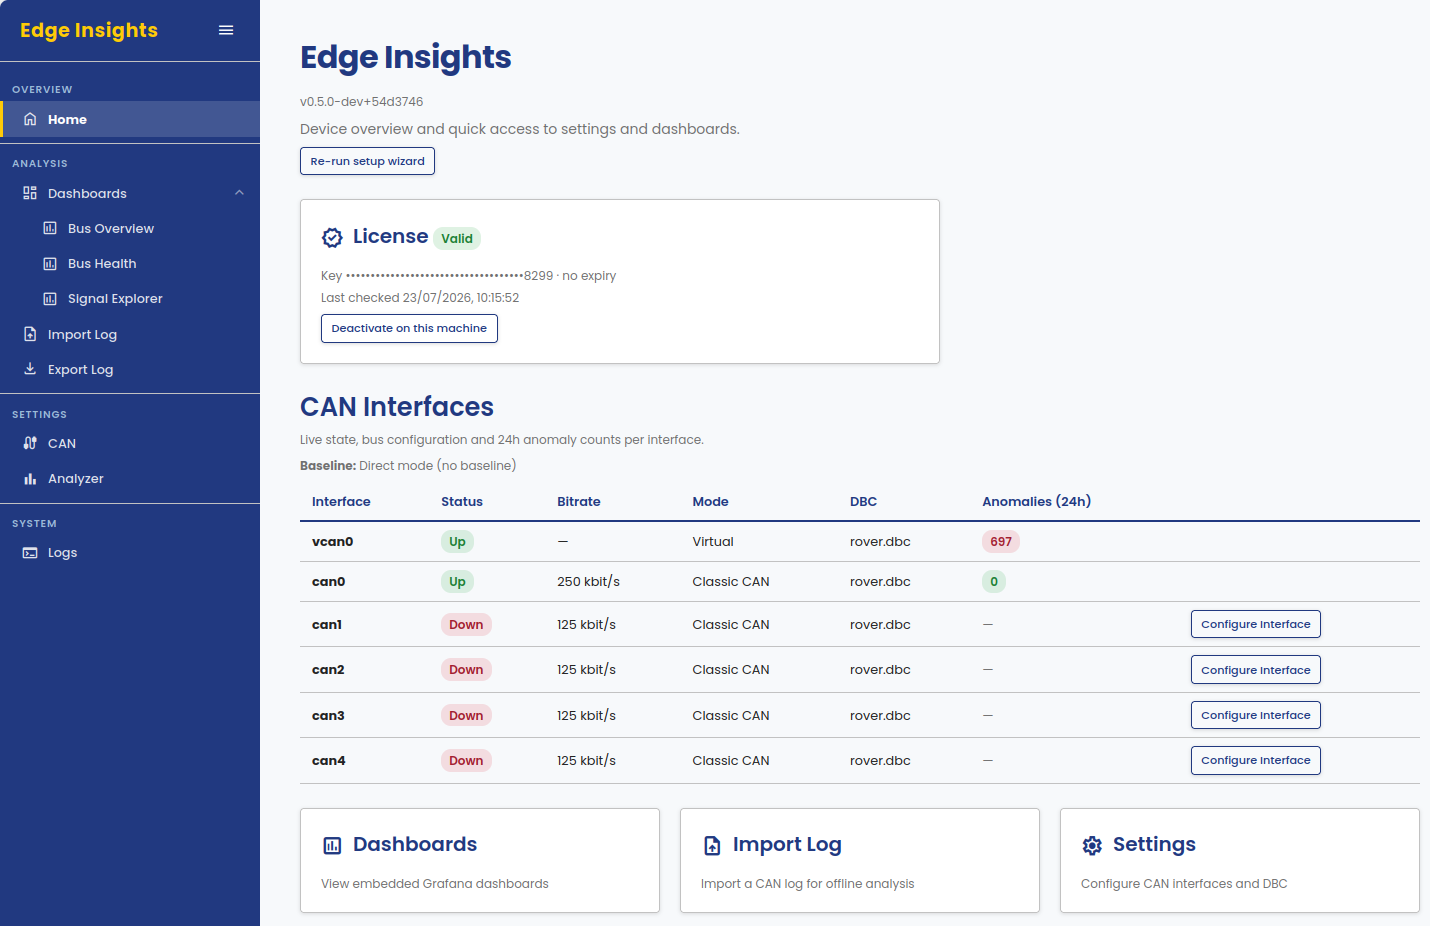
The Home page is the starting point. It shows:
- Re-run setup wizard: opens the setup wizard again, to change the CAN interface, DBC file, or baseline mode. The wizard starts from the current settings and saves nothing until its last step.
- License: activation status for this installation.
- CAN Interfaces: live status, bus configuration, and a 24-hour anomaly count for each interface.
- Quick links to Dashboards, Import Log, and Settings.
Navigation
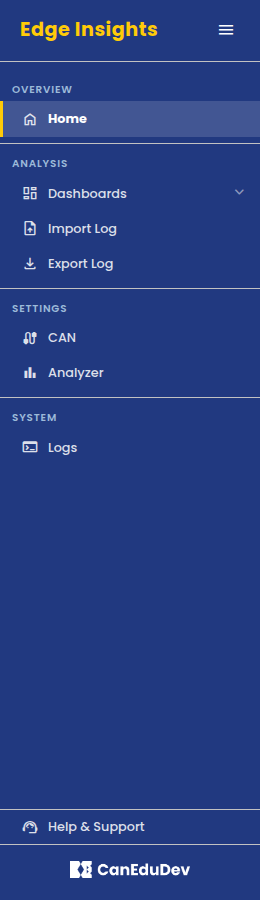
The sidebar groups the rest of the portal:
- Analysis: Dashboards, Import Log, and Export Log.
- Settings: CAN Settings and Analyzer Settings.
- System: Logs.
The Help & Support button at the bottom of the sidebar opens the support flow from any page.
Licensing
The License card on the Home page shows whether Edge Insights is activated on this installation. To get a license key, see Getting Edge Insights.
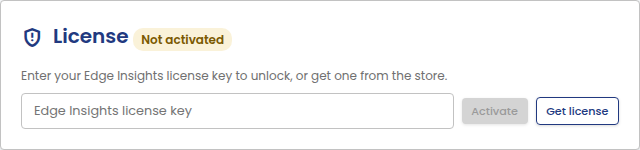
To activate, enter your license key and click Activate:
Once activated, the card shows a masked key, expiry (if any), and when the license was last checked:
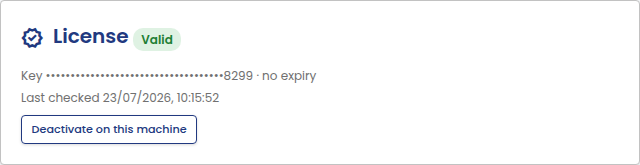
To move a license to a different machine, deactivate it here first:
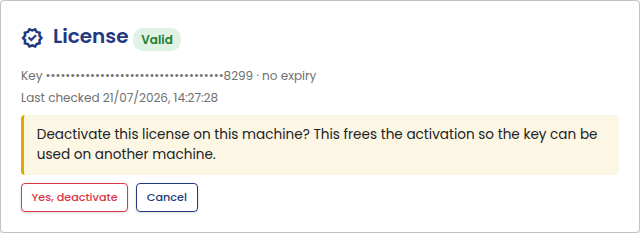
Confirming frees the activation so the same key can be used on another machine.
You can also deactivate a license without access to the machine it's activated on, from the License keys page of your canedudev.com account.